


COVID-19 Statistics 4.28.2020
| Confirmed Cases | Cases per 100,000 Population | Total Deaths | Deaths per 100,000 Population | |
|---|---|---|---|---|
| Kent | 73 | 376.62 | 4 | 20.64 |
| QA | 49 | 97.26 | 0 | 0.00 |
| Talbot | 37 | 99.51 | 1 | 2.69 |
| Caroline | 70 | 210.18 | 0 | 0.00 |
| Dorchester | 56 | 175.39 | 2 | 6.26 |
| Mid-Shore | 285 | 165.53 | 7 | 4.07 |
| Cecil | 165 | 160.42 | 8 | 7.78 |
| Md. | 20,113 | 332.68 | 929 | 15.37 |
| Del. | 4,575 | 469.83 | 137 | 14.07 |
| USA | 1,002,498 | 305.42 | 57,266 | 17.45 |
| World | 3,083,467 | 39.65 | 213,824 | 2.75 |
Sources: State and local health departments, Johns Hopkins University.
The Spy updates this chart between 2 and 3 p.m. Statewide data is updated about 10 a.m. each day; counties may update data throughout the day until 5 p.m. Hopkins updates its map data throughout the day. If county and state data conflict, county data is reported.
Key points for April 28
• The number of confirmed COVID-19 cases in Maryland has topped 20,000, while the U.S. number is more than 1 million.
• In the past 24 hours, Maryland reported 626 new COVID-19 cases, bringing the statewide total to 20,113.
• Kent County has 73 confirmed cases.
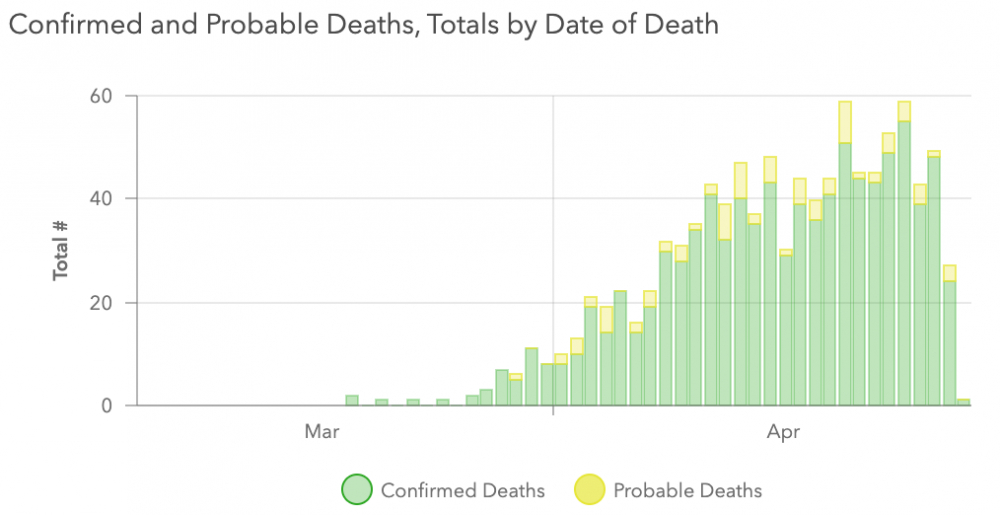
• Of the state’s 929 deaths, 71 were in the last 24 hours; another 87 deaths in Maryland are likely due to the novel coronavirus,
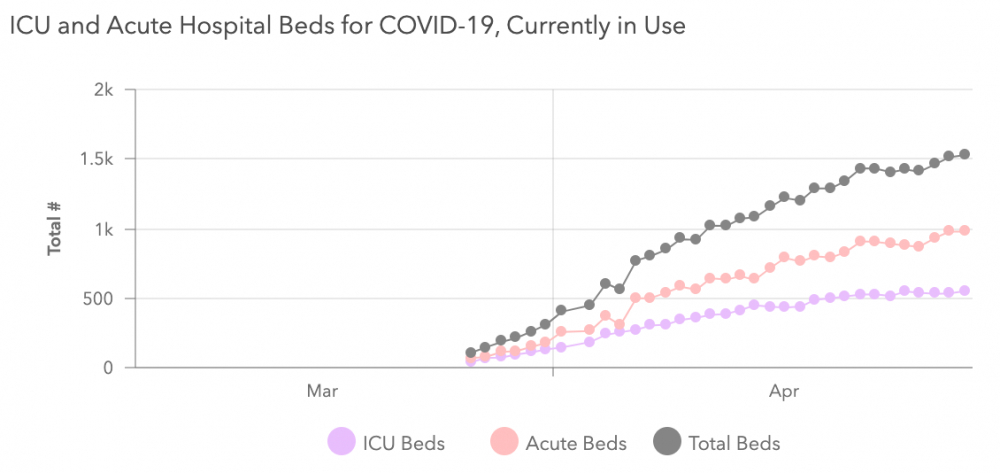
• There currently are 1,528 people hospitalized — 977 in acute care and 551 in intensive care; 15 people were hospitalized the last 24 hours. 4,268 Maryland residents have ever been hospitalized as a result of COVID-19.
• Maryland says 1,295 patients have been released from isolation, including 32 in the last 24 hours.
• The state reports 87,672 negative test results, including 2,183 in the last 24 hours.
• Benchmarks for the Maryland Roadmap to Recovery include a 14-day downward trajectory of COVID-19 cases, hospitalization rates (including ICU bed usage), and number of deaths.
Source: coronavirus.maryland.gov
Source: coronavirus.maryland.gov
J Anne Hammer says
I appreciate the daily updates but having trouble with the format changes. I get part of graph but no info. I also really miss the column in the chart showing the change in cases since the last report and hope you will return that information column.
Thanks.
Nancy McCloy says
I also miss the change in cases.
John Griep says
Thanks for you comment and for reading The Spy. For this afternoon’s post, we will have both versions of the table (static and more interactive), including daily change.
John Griep says
Thanks for you comment and for reading The Spy. We are working on some back-end items that hopefully will make the table work properly on mobile devices. For this afternoon’s post, we will have both versions of the table, including daily change.