| Confirmed Cases | Cases per 100,000 Population | Total Deaths | Deaths per 100,000 Population | |
|---|---|---|---|---|
| Kent | 70 | 361.14 | 4 | 20.64 |
| QA | 49 | 97.26 | 0 | 0.00 |
| Talbot | 37 | 99.51 | 1 | 2.69 |
| Car | 69 | 207.18 | 0 | 0.00 |
| Dor | 55 | 172.26 | 2 | 6.26 |
| Mid-Shore | 280 | 162.62 | 7 | 4.07 |
| Cecil | 164 | 159.45 | 8 | 7.78 |
| Md. | 19,487 | 322.33 | 858 | 14.19 |
| Del. | 4,162 | 427.41 | 120 | 12.32 |
| USA | 968,203 | 294.97 | 54,938 | 16.74 |
| World | 2,995,456 | 38.52 | 207,583 | 2.67 |
Sources: State and local health departments, Johns Hopkins University.
The Spy updates this chart between 2 and 3 p.m. Statewide data is updated about 10 a.m. each day; counties may update data throughout the day until 5 p.m. Hopkins updates its map data throughout the day. If county and state data conflict, county data is reported.
Key points for April 27
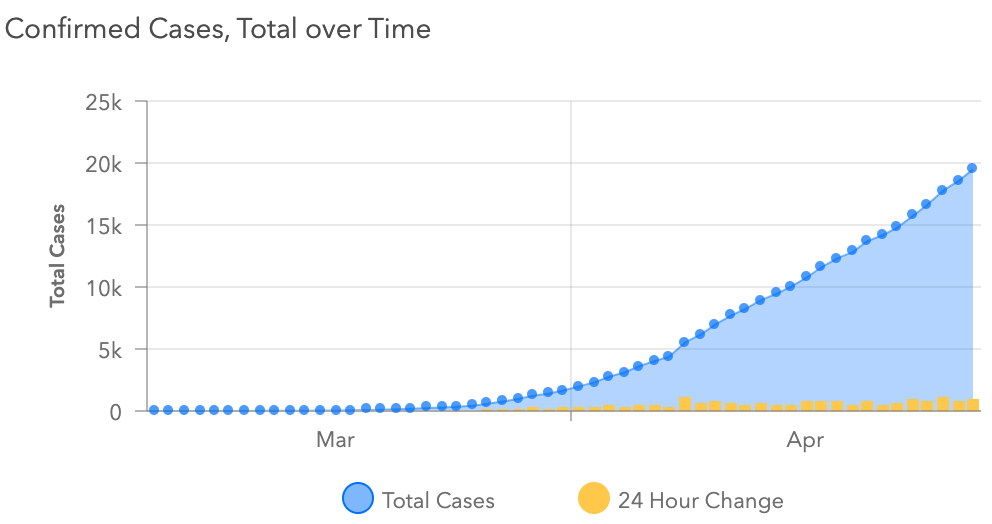
• In the past 24 hours, Maryland reported 906 new COVID-19 cases, bringing the statewide total to 19,487.
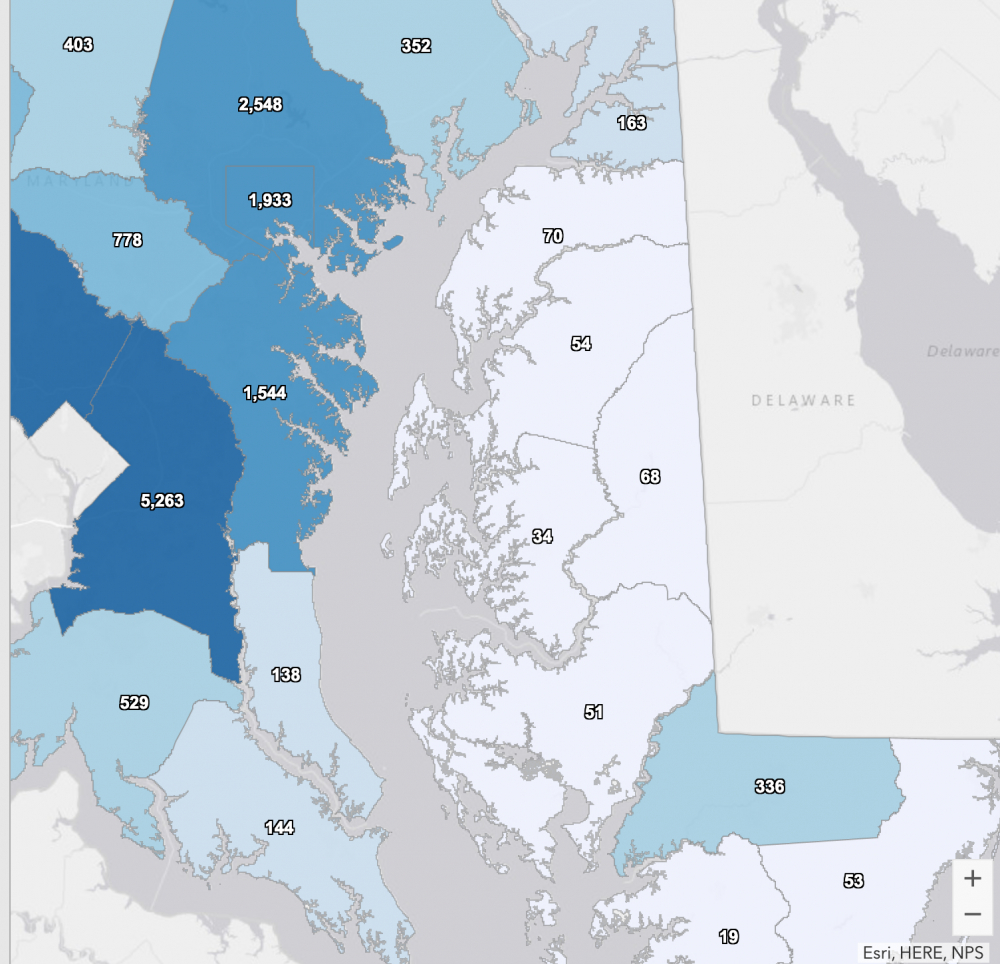
• Two more people in Kent County tested positive for COVID-19 over the weekend, for a total of 70 confirmed cases. Kent County also reports a total of four deaths from the novel coronavirus.
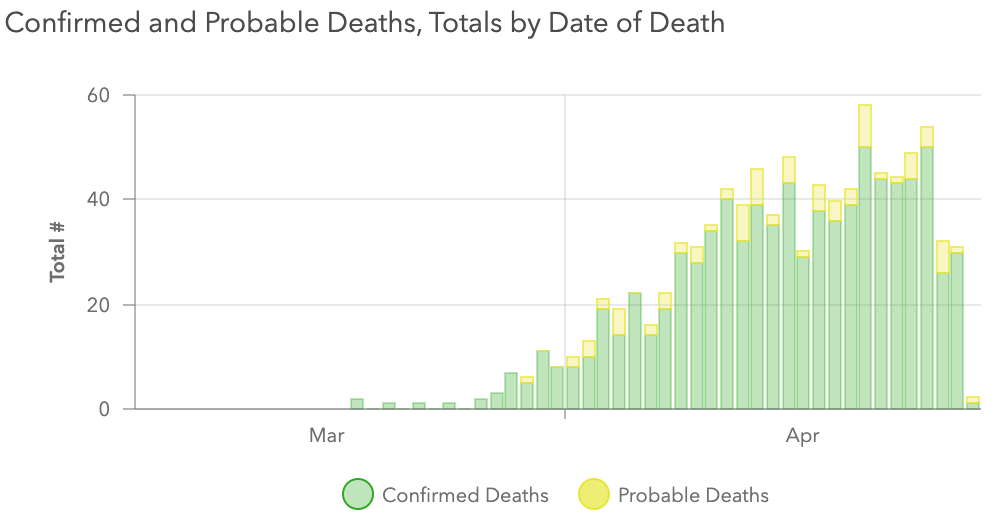
• Of the state’s 858 deaths, 442 have occurred in long-term care facilities; another 87 deaths in Maryland are probably due to COVID-19. There were 31 deaths in Maryland in the last 24 hours.
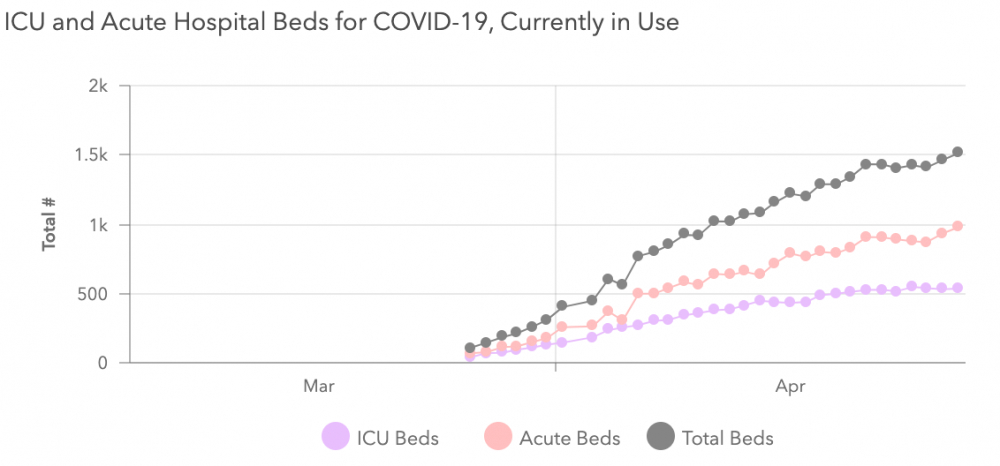
• There currently are 1,513 people hospitalized — 978 in acute care and 535 in intensive care; 50 people were hospitalized the last 24 hours. About 4,100 people have ever been hospitalized as a result of COVID-19.
• Maryland says 1,263 patients have been released from isolation, including 86 in the last 24 hours.
• The state reports 85,489 negative test results, including 7,405 in the last 24 hours.
• The poultry industry accounts for a number of new cases. The CDC has sent teams to Delaware, Maryland, and Virginia to help with contact tracing.
• Benchmarks for the Maryland Roadmap to Recovery include a 14-day downward trajectory of COVID-19 cases, hospitalization rates (including ICU bed usage), and number of deaths.


Robin Wood says
Thank you for posting a more complete picture of the virus’ impact in Kent County. I figured Kent was comparatively high in per capita infections, and your chart shows just how high the rate of infections and deaths here is.
Robin Wood says
Don’t you mean cases and deaths per 100,000?
Charles Taylor says
Note below the first chart: Sources: State and local health departments, Johns Hopkins University. Per capita is the rate per 100,000 population (based on the most recent population estimates for the state and counties).